Washington Commanders vs Minnesota Vikings Match Player Stats: J.J. McCarthy Leads Vikings to a Stunning 31-0 Shutout
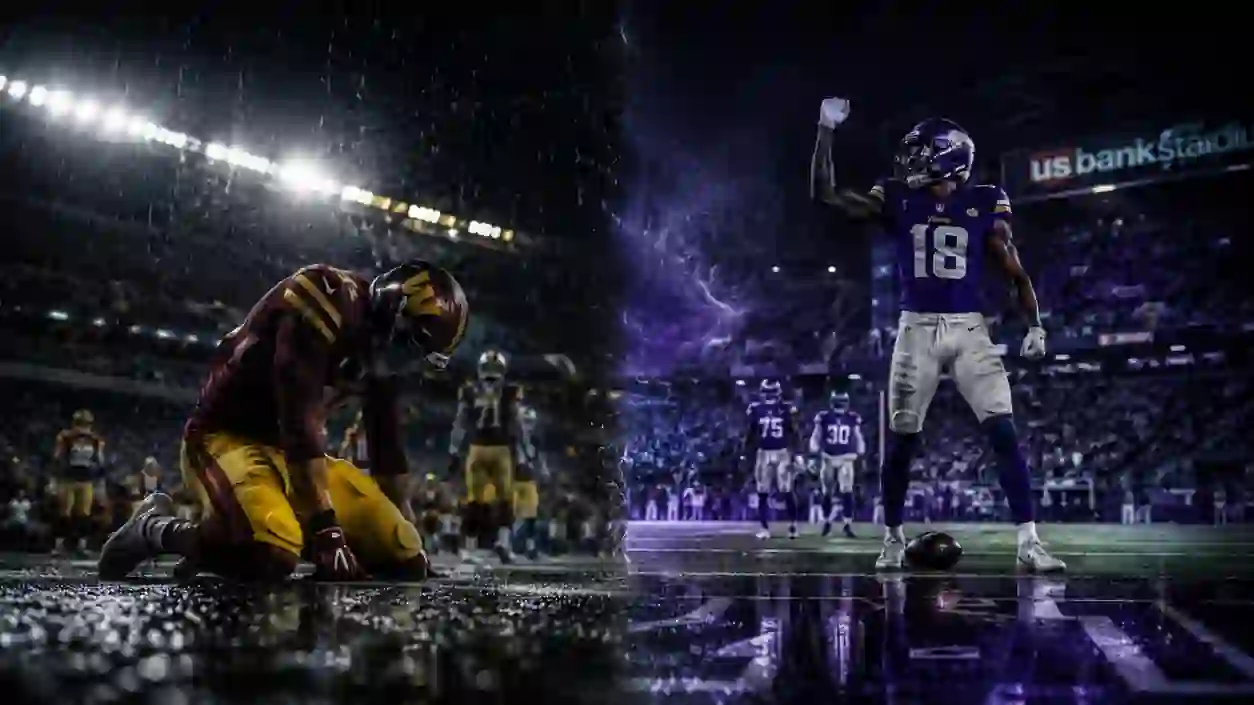
Losing streaks have a way of snowballing, and nobody watching the Washington Commanders vs Minnesota Vikings match player stats from Week 14 needed a scoreboard to see it happening live. Washington arrived at U.S. Bank Stadium already reeling, and Minnesota made sure the pain didn’t stop. Behind a career day from a young quarterback and a defense that refused to bend, the Vikings turned a desperate midseason matchup into their most complete performance of the year.
The Lead
On Sunday, December 7, 2025, the Minnesota Vikings hosted the Washington Commanders at U.S. Bank Stadium in Minneapolis in front of 66,810 fans. What was billed as a near pick ’em on the betting boards turned into a rout, with Minnesota walking away 31-0 winners in a game that never felt as close as the pregame spread suggested. The result dropped Washington to 3-10 on the season and extended its skid to eight straight losses, while Minnesota improved to 5-8 and snapped its own three-game slide.
The story of the afternoon was J.J. McCarthy, who returned from a concussion absence to throw a career-high three touchdown passes without a single turnover, and a Vikings defense that forced three takeaways while Washington’s offense sputtered from the opening series.
Washington’s night got even worse when starting quarterback Jayden Daniels was forced out early in the third quarter after re-injuring his surgically-repaired elbow, leaving backup Marcus Mariota to finish out the shutout loss. By the time the final whistle sounded, Minnesota had out-gained Washington 313 yards to 206 and controlled the ball for nearly 35 minutes.
Match Overview Table
| Information | Match Details |
| Event | NFL 2025 Regular Season, Week 14 |
| Game | Washington Commanders vs Minnesota Vikings |
| Date | Sunday, December 7, 2025 |
| Venue | U.S. Bank Stadium, Minneapolis, MN |
| Attendance | 66,810 |
| Winner | Minnesota Vikings |
| Final Score | Vikings 31, Commanders 0 |
| Broadcast | FOX |
Core Match Statistics Overview
Anyone digging into this Commanders vs Vikings box score will notice the gap wasn’t just about the final score — it showed up in nearly every core statistical category.
| Team Stat | Washington Commanders | Minnesota Vikings |
| Total Yards | 206 | 313 |
| Passing Yards | 108 | 163 |
| Completion % | 45.8% (11/24) | 69.6% (16/23) |
| Passer Rating | 24.3 | 129.2 |
| Rushing Yards | 107 | 162 |
| First Downs | 12 | 25 |
| Turnovers | 3 | 0 |
| Sacks Allowed | 2 | 4 |
| Penalties | 4 for 34 yards | 3 for 24 yards |
| Time of Possession | 25:08 | 34:52 |
Passing Efficiency
- McCarthy’s 129.2 rating and zero incompletions on target throws stood in stark contrast to Washington’s 24.3 mark, which included two interceptions.
- Minnesota’s passing attack needed only 23 attempts to produce three touchdowns, an efficiency rate Washington’s quarterback tandem couldn’t come close to matching.
Time of Possession and Ball Control
- Minnesota’s nearly 35-minute possession advantage let the Vikings dictate tempo and kept a banged-up Washington offense off the field for long stretches.
- A 19-play, 98-yard scoring drive that drained over 12 minutes off the clock effectively decided the game’s rhythm before halftime even arrived.
Turnover Battle
- Washington’s three giveaways, two interceptions and a lost fumble, handed Minnesota short fields and repeatedly killed any chance of offensive rhythm.
- Minnesota’s defense turned those takeaways into real value, with two interceptions returned for a combined 51 yards.
Rushing Production
- Minnesota ran for 162 yards on 34 carries while Washington managed just 107 on 23 attempts, despite entering the game with one of the league’s better ground games.
- The Vikings’ commitment to the run, especially late in drives, let them control clock and set up play-action for McCarthy’s touchdown throws.
Period-by-Period Analysis
| Quarter | Washington Commanders | Minnesota Vikings |
| 1st Quarter | 0 | 7 |
| 2nd Quarter | 0 | 7 |
| 3rd Quarter | 0 | 10 |
| 4th Quarter | 0 | 7 |
| Final | 0 | 31 |
- First Quarter: Minnesota drove 61 yards on seven plays for the opening score, a J.J. McCarthy deep shot to Josh Oliver for 18 yards. Washington briefly threatened on the ensuing drive with a fourth-and-goal try from the 2, but a drop in the end zone kept the Commanders off the board and set the tone for the rest of the afternoon.
- Second Quarter: The Vikings put together a marathon 19-play, 98-yard drive that consumed over 12 minutes and converted five straight third downs, finishing with a Jordan Mason touchdown run. That single possession stripped Washington of both scoreboard and clock control heading into the break.
- Third and Fourth Quarters: Minnesota added a field goal and two more short touchdown passes, the second to Oliver and the third to T.J. Hockenson, while Washington’s situation worsened when Jayden Daniels exited with an elbow injury. Marcus Mariota’s turnover-plagued relief work sealed a fully one-sided finish.
Washington Commanders Player Statistics
Washington’s individual numbers reflect an offense that never found any rhythm, especially after a first-half injury changed the complexion of the entire game plan.
| Player | Stat Line |
| Chris Rodriguez (RB) | 10 carries, 52 yards, 5.2 avg |
| Terry McLaurin (WR) | 3 receptions, 6 targets, 41 yards, 13.7 avg |
| Jayden Daniels / Marcus Mariota (QB, combined) | 11-of-24, 108 yards, 2 INT |
| Washington Defense | 4 sacks, 5 passes defended, 0 takeaways |
Chris Rodriguez was the lone bright spot on the ground, averaging over five yards a carry even as the Commanders abandoned the run early while trailing. Terry McLaurin remained the primary receiving target, but with the offense unable to sustain drives, his 41 yards on three catches came in disconnected bursts rather than a real scoring threat.
The quarterback situation unraveled when Daniels went down with a re-dislocated elbow midway through the third quarter, and Mariota’s two turnovers in relief compounded an already lopsided afternoon. Washington’s defense actually generated four sacks and forced consistent pressure, but zero takeaways meant the unit never got the ball back for its own offense.
Minnesota Vikings Player Statistics
Minnesota’s stat sheet tells the story of a genuinely complete team performance, not just one standout showing.
| Player | Stat Line |
| J.J. McCarthy (QB) | 16-of-23, 163 yards, 3 TD, 0 INT, 129.2 rating |
| Aaron Jones (RB) | 14 carries, 76 yards, 5.4 avg |
| Jordan Mason (RB) | Part of a 25-carry, 128-yard rushing tandem with Jones, 1 rushing TD |
| Josh Oliver (TE) | 2 receptions, 24 yards, 2 TD |
| T.J. Hockenson (TE) | Game-clinching short touchdown reception |
| Minnesota Defense | 2 INT, 1 forced fumble, 2 sacks |
McCarthy’s turnover-free, three-touchdown outing in just his seventh career start was the headline of these Washington Commanders vs Minnesota Vikings match player stats, and he spread the ball to his tight ends for all three scores. Jones and Mason combining for 128 yards on 25 carries gave the Vikings a physical rushing complement to McCarthy’s efficient passing, keeping Washington’s defense guessing between run and play-action throughout.
Oliver’s two touchdown grabs made him the most productive receiver on the field despite modest overall volume, while Hockenson’s late score in the fourth quarter put the finishing touch on the shutout. Minnesota’s defense matched the offensive effort by forcing two interceptions and a fumble, ensuring Washington’s few promising drives ended in Vikings possession.
Statistical Leaders Summary Table
| Category | Washington Commanders | Minnesota Vikings |
| Leading Passer | Daniels/Mariota (108 yds, 2 INT) | J.J. McCarthy (163 yds, 3 TD) |
| Leading Rusher | Chris Rodriguez (52 yds) | Aaron Jones (76 yds) |
| Leading Receiver | Terry McLaurin (41 yds, 3 rec) | Josh Oliver (24 yds, 2 TD) |
| Defensive Playmaker | Washington pass rush (4 sacks) | Vikings secondary (2 INT) |
Why Minnesota Won
Balanced Offensive Production
| Metric | Washington | Minnesota |
| Passing Yards | 108 | 163 |
| Rushing Yards | 107 | 162 |
| Total Yards | 206 | 313 |
Minnesota didn’t lean on one dimension. Both the run and pass game produced comparable output, which made the Vikings’ offense far harder to key on than a Washington unit that had to abandon its ground game once the deficit grew.
Quarterback Efficiency Under Pressure
McCarthy took four sacks yet still posted a 129.2 rating and zero turnovers, a sign of poise that Washington’s quarterbacks simply couldn’t match given their 24.3 combined rating and two picks.
Takeaway Margin
A plus-three turnover margin, two interceptions and a forced fumble against zero giveaways of their own, gave Minnesota extra possessions and repeatedly flipped field position in their favor.
Clock Control Through the Run Game
Nearly 35 minutes of possession time meant Washington’s offense simply didn’t get enough opportunities to climb back into the game, regardless of who was playing quarterback.
Why Washington Lost
Costly Turnovers at Key Moments
Two interceptions and a lost fumble erased any chance of building offensive rhythm, and each turnover came at moments when Washington needed a positive answer.
Heavy Dependence on a Compromised Quarterback Room
Jayden Daniels’ third-quarter elbow injury forced Marcus Mariota into relief duty, and the drop-off in efficiency, an interception and a fumble on his watch, made an already difficult deficit essentially unclimbable.
Red Zone and Fourth-Down Failures
A dropped fourth-and-goal pass from the 2-yard line in the first quarter symbolized Washington’s day; scoring opportunities were there early, but the execution wasn’t.
Historical Context & Advanced Insights
Season Series Breakdown
| Matchup | Date | Result |
| Commanders at Vikings | December 7, 2025 | Vikings win, 31-0 |
This was the only scheduled meeting between the two teams in the 2025 season, part of the NFC East vs NFC North interconference rotation. Historically, Minnesota holds a narrow all-time series edge over Washington, and this shutout added another lopsided chapter to that long-running head-to-head history.
Advanced Statistical Insights
The efficiency gap here is best understood through completion percentage relative to yards per attempt. McCarthy completed 69.6% of his throws at 5.6 net yards per attempt for three scores, essentially the profile of a quarterback in complete rhythm with his play-caller. Washington’s tandem, by contrast, completed under 46% of attempts at a paltry 3.8 yards per attempt, a passing expected-points killer regardless of who lines up under center.
Pair that with the time-of-possession split, nearly 35 minutes to 25, and it becomes clear Minnesota didn’t just win the big plays; the Vikings won the game on a snap-by-snap, possession-by-possession basis. That 19-play, 98-yard second-quarter drive alone, five conversions on five third-down tries, is the kind of situational efficiency that turns a competitive spread into a laugher.
Game Implications & Key Lessons
What This Means for Minnesota
- A statement shutout win, following a shutout loss the week before, shows real resilience and offensive identity forming around McCarthy.
- The Jones-Mason rushing tandem gives Minnesota a physical complement that keeps opposing defenses honest heading into the final stretch of the season.
- McCarthy’s turnover-free outing should ease any lingering concerns about his readiness after multiple injury absences.
What This Means for Washington
- An eighth straight loss and a season-worst shutout point to deeper structural issues beyond just quarterback health.
- The re-injury to Jayden Daniels’ elbow raises real questions about his availability and long-term health management down the stretch.
- Red zone execution and protecting the football need immediate attention if Washington hopes to avoid a fully lost season.
Key Lessons
- Turnover margin remains one of the single most predictive stats in football outcomes.
- Time of possession compounds advantages, more snaps mean more chances to capitalize.
- A balanced run-pass attack is harder to defend than a one-dimensional offense.
- Quarterback depth and health management can decide a season, not just a single game.
- Situational third-down efficiency on long drives can single-handedly swing momentum.
- Red zone execution, not just yardage, ultimately separates wins from shutout losses.
Frequently Asked Questions
Who won the Washington Commanders vs Minnesota Vikings game?
The Minnesota Vikings won 31-0 over the Washington Commanders on December 7, 2025, at U.S. Bank Stadium.
What were J.J. McCarthy’s stats in the game?
McCarthy completed 16 of 23 passes for 163 yards and three touchdowns with zero interceptions, good for a 129.2 passer rating.
Why did Jayden Daniels leave the game?
Daniels was forced out midway through the third quarter after re-injuring the same elbow he had previously dislocated, an injury that had already cost him time earlier in the season.
Who led Washington in receiving and rushing?
Terry McLaurin led Washington’s receivers with 41 yards on three catches, while Chris Rodriguez paced the rushing attack with 52 yards on 10 carries.
How many turnovers did each team have?
Washington committed three turnovers, two interceptions and a lost fumble, while Minnesota committed none.
Was this the only meeting between the two teams in 2025?
Yes, this was the sole regular-season matchup between the Commanders and Vikings during the 2025 season.
Conclusion
This wasn’t a game decided by one big play or a single standout stat line. It was decided by efficiency, ball control, and discipline, areas where Minnesota simply outperformed Washington from snap one.
J.J. McCarthy’s turnover-free, three-touchdown day showed what a quarterback playing within a well-structured offense can do, while Washington’s injury-riddled, turnover-prone afternoon showed exactly how quickly a season can spiral. When teamwork and situational execution consistently beat individual talent, the final score tends to look exactly like this one did.